Topic Models
One of the virtues of computational text analysis is that it enables us to process huge amounts of text that would be difficult (or maybe even impossible) for a single human reader. In fact, when we’re dealing with so many documents, we might not even know exactly what kind of themes, issues, or ideas are being featured.
A topic model is a type of statistical model that helps identity “topics” that occur in a collection of documents, or corpus. This approach is particularly useful for synthesizing large corpora—e.g. thousands or millions of documents—that would be otherwise difficult to synthesize by hand. Imagine trying to read all of these documents by yourself and then summarizing which topics are common or unique across all of them! Topic models are a great way to make this process more efficient by leveraging statistical properties of natural language to categorize large bodies of text.
The key intuition of a topic model is that we expect certain words to appear together in context if they refer to the same topic.
For example, we might expect that:
“dictator”, “vizier”, and “repression” will appear together more often in documents about autocrats
“democrat”, “liberty”, and “freedom” will appear together more ofen in documents about democrats
These words can be construed as “topics” wherein a single document can contain multiple topics in different proportions. For example, 80% of a document may be devoted to the dictators topic and remaining 20% is devoted to the democrats topic.
This is basically what a topic model does: leverage the statistical properties of texts to identify clusters of words that co-occur (i.e. topics); then use these word clusters to classify documents by topics.
Let’s walk through some popular approaches to this type of modeling and see what it can (and can’t) tell us about a body of text.
%matplotlib inline

import warnings, logging

warnings.filterwarnings("ignore",category=DeprecationWarning) #ignore warnings
logging.basicConfig(format='%(asctime)s : %(levelname)s : %(message)s', level=logging.ERROR)
#logging is a means of tracking events that happen when some software runs.
Now let’s load our text data.
Today we will run some topic models on a corpus of Tweets scraped from Twitter using the rtweet package in R. I did a simple search for the word “autocray” and collected the most recent 5,000 tweets. I then stored the output as a CSV.
First step is loading the Twitter CSV file into Python.
import pandas as pd

file = "~/autocracy_tweets.csv"

df = pd.read_csv(file)
Let’s take a peek at the data structure using the “head” command
df.head()
| user_id | status_id | created_at | screen_name | text | source | display_text_width | reply_to_status_id | reply_to_user_id | reply_to_screen_name | ... | statuses_count | favourites_count | account_created_at | verified | profile_url | profile_expanded_url | account_lang | profile_banner_url | profile_background_url | profile_image_url | |
|---|---|---|---|---|---|---|---|---|---|---|---|---|---|---|---|---|---|---|---|---|---|
| 0 | x1017830923948122112 | x1316432243099918337 | 2020-10-14 17:34:39 | fredmiracle2 | Donald Trump’s first term was characterized by theft, lies, corruption, and the incitement of vi... | Twitter Web App | 205 | NaN | NaN | NaN | ... | 2971 | 1426 | 2018-07-13 17:59:37 | False | NaN | NaN | NaN | NaN | NaN | http://pbs.twimg.com/profile_images/1127335179075252224/gWWT_5Uv_normal.png |
| 1 | x1083462522 | x1316432017656033281 | 2020-10-14 17:33:45 | Volteer95 | @JenkindLance @Lagiacrus96 @dragbug1 @nick_stryker @MattBaume @feliciaday What the fuck are you ... | Twitter for Android | 280 | x1316426428595007491 | x1281671562211532802 | JenkindLance | ... | 12132 | 46837 | 2013-01-12 16:36:51 | False | https://t.co/C5XASi5cMa | https://www.youtube.com/user/MegaMapler2000 | NaN | https://pbs.twimg.com/profile_banners/1083462522/1565878899 | http://abs.twimg.com/images/themes/theme1/bg.png | http://pbs.twimg.com/profile_images/1251117275781967873/zhR96ZAy_normal.jpg |
| 2 | x22080510 | x1316431988648181766 | 2020-10-14 17:33:38 | AmbitDiva | Some of these Trumpers want an autocracy and for Trump to "assign" them a Woman and give them a ... | Twitter Web App | 199 | NaN | NaN | NaN | ... | 24697 | 51948 | 2009-02-26 23:43:22 | False | https://t.co/rX6gnLfgAG | http://snatchingedges.com | NaN | https://pbs.twimg.com/profile_banners/22080510/1508380722 | http://abs.twimg.com/images/themes/theme4/bg.gif | http://pbs.twimg.com/profile_images/1136467511279542273/CQVxiZFU_normal.png |
| 3 | x35606154 | x1316431817361195009 | 2020-10-14 17:32:58 | bmangh | Last Exit From Autocracy | America survived one Trump term. It wouldn’t survive a second. https:... | Twitter for iPhone | 113 | NaN | NaN | NaN | ... | 582373 | 154 | 2009-04-26 23:57:48 | False | https://t.co/Nv8Q66R2Ou | http://phollo.me/bmangh | NaN | NaN | http://abs.twimg.com/images/themes/theme1/bg.png | http://pbs.twimg.com/profile_images/2881649256/ac3af9f9f33b7891bab2ed8ffae90b51_normal.jpeg |
| 4 | x213150691 | x1316431810952298499 | 2020-10-14 17:32:56 | AndrewRei15 | @CIAspygirl 2/ all over voting booths correctly pointed out that he is dead? He got almost 70% o... | Twitter Web App | 277 | x1316429870465916928 | x21445143 | CIAspygirl | ... | 19750 | 565 | 2010-11-08 03:10:27 | False | NaN | NaN | NaN | NaN | http://abs.twimg.com/images/themes/theme1/bg.png | http://pbs.twimg.com/profile_images/850813293979553792/EgP-qtww_normal.jpg |
5 rows × 90 columns
Exploring the data
What are the variables contained in the dataframe?
df.columns
Index(['user_id', 'status_id', 'created_at', 'screen_name', 'text', 'source',
       'display_text_width', 'reply_to_status_id', 'reply_to_user_id',
       'reply_to_screen_name', 'is_quote', 'is_retweet', 'favorite_count',
       'retweet_count', 'quote_count', 'reply_count', 'hashtags', 'symbols',
       'urls_url', 'urls_t.co', 'urls_expanded_url', 'media_url', 'media_t.co',
       'media_expanded_url', 'media_type', 'ext_media_url', 'ext_media_t.co',
       'ext_media_expanded_url', 'ext_media_type', 'mentions_user_id',
       'mentions_screen_name', 'lang', 'quoted_status_id', 'quoted_text',
       'quoted_created_at', 'quoted_source', 'quoted_favorite_count',
       'quoted_retweet_count', 'quoted_user_id', 'quoted_screen_name',
       'quoted_name', 'quoted_followers_count', 'quoted_friends_count',
       'quoted_statuses_count', 'quoted_location', 'quoted_description',
       'quoted_verified', 'retweet_status_id', 'retweet_text',
       'retweet_created_at', 'retweet_source', 'retweet_favorite_count',
       'retweet_retweet_count', 'retweet_user_id', 'retweet_screen_name',
       'retweet_name', 'retweet_followers_count', 'retweet_friends_count',
       'retweet_statuses_count', 'retweet_location', 'retweet_description',
       'retweet_verified', 'place_url', 'place_name', 'place_full_name',
       'place_type', 'country', 'country_code', 'geo_coords', 'coords_coords',
       'bbox_coords', 'status_url', 'name', 'location', 'description', 'url',
       'protected', 'followers_count', 'friends_count', 'listed_count',
       'statuses_count', 'favourites_count', 'account_created_at', 'verified',
       'profile_url', 'profile_expanded_url', 'account_lang',
       'profile_banner_url', 'profile_background_url', 'profile_image_url'],
      dtype='object')
What’s in a tweet?
Before doing any kind of computation analysis, it is a good idea to explore the corpus yourself – in short, read some of the actual tweets!
Exploring the corpus by hand helps you refine your analysis. The more you understand about the underlying content, the better you will be able to pre-process the corpus (keep the relevant stuff and filter out irrelevant text). To that end, there’s no substitute for deep reading.
df.text[0], df.text[10], df.text[20]
('Donald Trump’s first term was characterized by theft, lies, corruption, and the incitement of violence, @davidfrum argues. A second term could spell the end of American democracy. \n\nhttps://t.co/kt40nNDGkY',
 'Lenin argued that, under conditions of a proletarian state, and because of the backwardness in Russia because of the autocracy, WWI and the Civil War, state capitalism is a necessarily transitional phase towards socialism.\n\nhttps://t.co/FSE56Sdw9U',
 '*The authoritarian populist defines “the people” to exclude anyone who thinks differently. Only his followers count as legitimate citizens.*   We are living in an era of minority rule.\nhttps://t.co/4FDF1sO8fg')
What kinds of things do you notice about these tweets – and how might that inform what kinds of terms you want to keep or discard?
Convert documents (tweets) to vectors
Once we have a sense of what’s contained in the corpus, we can make better decisions in deciding how to preprocess our corpus.
Let’s start by transforming the data into a document-term matrix using the CountVectorizer class. We specifically want to transform the raw text of each tweet, i.e. the column called ‘text’.
Pay attention to how we need to modify the pandas dataframe object in order to use vectorizer.fit_transform(). Also note that the following cell may take awhile to run depending on the size of your corpus.
import numpy as np

from sklearn.feature_extraction.text import CountVectorizer

vectorizer = CountVectorizer(min_df=20, # min_df: discard words appearing in fewer than n documents, percentage or count
                             max_df=.90, # max_df: discard words appearing in more than n documents, percentage or count
                             decode_error='replace',
                             strip_accents='unicode', # noticed some encoding errors when examining the dataframe
                             stop_words='english')

dtm = vectorizer.fit_transform(df.text.astype(str).to_list()) #requires iterable object over raw text documents
vocab = vectorizer.get_feature_names()

dtm = dtm.toarray()
vocab = np.array(vocab)
dtm.shape
(5000, 579)
A Probabilistic Topic Model
Let’s first try running a probabilistic topic model, which represents a topic as a probability mass function over words.
The sklearn package has a Latent Dirichlet Allocation package which we can use to estimate the probabilistic model.
from sklearn.decomposition import LatentDirichletAllocation

# Run LDA

lda = LatentDirichletAllocation(n_components=10,
                                max_iter=5,#maximum number of iterations
                                learning_method='online', #Method used to update
                                learning_offset=50,
                                random_state=0).fit(dtm)


# Display top words associated with each topic

def display_topics(model, feature_names, no_top_words):
    for topic_idx, topic in enumerate(model.components_):
        print("Topic %d:" % (topic_idx))
        print(" ".join([feature_names[i] for i in topic.argsort()[:-no_top_words - 1:-1]]))

no_top_words = 15
display_topics(lda, vocab, no_top_words)
Topic 0:
party state china russia amp elections like dictatorship far tyranny left self step better communism
Topic 1:
trump don democracy stop https just people need know want let say long years make
Topic 2:
reject https president trump ve india live senator government come foreign free bidenharris2020 disinformation reason
Topic 3:
https like trump election look fascism authoritarianism signs america news just warning read key surviving
Topic 4:
senmikelee amp want country democratic fascist liberty https trump mike republicans white lee peace people
Topic 5:
amp politics human run making regime did constitution society govt life covid autocratic yes point
Topic 6:
democracy country people think isn way mean doesn joebiden america government trying wants right vote
Topic 7:
https corruption end togo term american man lies democracy trump hide donald violence office davidfrum
Topic 8:
vote https democracy gop voting states biden new amp vs corrupt rights trump time united
Topic 9:
democracy realdonaldtrump republic trump power republican oligarchy rule ll law biden putin authoritarian party https
Exercises
-
Re-run the LDA topic model with different values for min_df and max_df. How does this change the size of your dtm? How does it change the topic results?
-
Now re-run the LDA topic model with 5, 15, and 20 topics. Do you see more or fewer distinct categories when you decrease and increase the number of topics in the modl?
-
Try adding different n-gram combinations to your topic models. This is done in
CountVectorizer()andTfidfVectorizer()using the inputngram_range=(). For example, if you wanted to include unigrams and bigrams, you would writeCountVectorizer(ngram_range(1,2)). Does this lead to different results?
Topic model visualization
The Gensim module has a lot of cool ways to visualize the output of topic models. We’ll explore some below.
Before we begin, be sure to execute the following line:
!python -m spacy download en
Now download or import the following modules:
# Gensim
import gensim, spacy, logging, warnings
import gensim.corpora as corpora
from gensim.utils import lemmatize, simple_preprocess
from gensim.models import CoherenceModel
import matplotlib.pyplot as plt
import re
Preprocessing text for gensim
Gensim has its own text preprocessing tools to create the document-term matrix.
Let’s begin by writing a simple function to tokenize our text.
def sent_to_words(sentences):
    for sent in sentences:
        sent = re.sub('\n', ' ', sent)  # remove newline chars
        sent = re.sub("\'", "", sent)  # remove single quotes
        sent = gensim.utils.simple_preprocess(str(sent), deacc=True)
        yield(sent)
tweets = df.text.values.astype(str).tolist() # recall this is how we convert the raw text data from our pandas dataframe into an iterable object
tweet_words = list(sent_to_words(tweets))
tweet_words
[['donald',
  'trump',
  'first',
  'term',
  'was',
  'characterized',
  'by',
  'theft',
  'lies',
  'corruption',
  'and',
  'the',
  'incitement',
  'of',
  'violence',
  'davidfrum',
  'argues',
  'second',
  'term',
  'could',
  'spell',
  'the',
  'end',
  'of',
  'american',
  'democracy',
  'https',
  'co',
  'kt',
  'nndgky'],
 ['jenkindlance',
  'lagiacrus',
  'dragbug',
  'nick_stryker',
  'mattbaume',
  'feliciaday',
  'what',
  'the',
  'fuck',
  'are',
  'you',
  'talking',
  'about',
  'the',
  'roman',
  'republic',
  'literally',
  'had',
  'system',
  'with',
  'voting',
  'blocks',
  'called',
  'tribes',
  'not',
  'direct',
  'popular',
  'vote',
  'election',
  'system',
  'and',
  'they',
  'still',
  'ended',
  'up',
  'turning',
  'into',
  'an',
  'autocracy',
  'and',
  'what',
  'does',
  'that',
  'have',
  'to',
  'do',
  'with',
  'anything',
  'anyway',
  'what',
  'the',
  'fuuuuuuuuuck'],
 ['some',
  'of',
  'these',
  'trumpers',
  'want',
  'an',
  'autocracy',
  'and',
  'for',
  'trump',
  'to',
  'assign',
  'them',
  'woman',
  'and',
  'give',
  'them',
  'job',
  'and',
  'home',
  'they',
  'watch',
  'the',
  'handmaids',
  'tale',
  'in',
  'delight',
  'women',
  'are',
  'just',
  'necessary',
  'accessories',
  'to',
  'them'],
 ['lol',
  'that',
  'dadabee',
  'protest',
  'starter',
  'pack',
  'dey',
  'funny',
  'me',
  'anyway',
  'the',
  'protests',
  'are',
  'absolutely',
  'necessary',
  'to',
  'demonstrate',
  'the',
  'power',
  'of',
  'the',
  'people',
  'and',
  'keep',
  'autocracy',
  'in',
  'check',
  'so',
  'lets',
  'gooo'],
 ...]
Stop words
Let’s create a customized stop words list. But don’t reinvent the wheel when you don’t have to – let’s first load the already-made NLTK stop words list as our baseline.
# NLTK Stop words
from nltk.corpus import stopwords
stop_words = stopwords.words('english')

print(stop_words)
['i', 'me', 'my', 'myself', 'we', 'our', 'ours', 'ourselves', 'you', "you're", "you've", "you'll", "you'd", 'your', 'yours', 'yourself', 'yourselves', 'he', 'him', 'his', 'himself', 'she', "she's", 'her', 'hers', 'herself', 'it', "it's", 'its', 'itself', 'they', 'them', 'their', 'theirs', 'themselves', 'what', 'which', 'who', 'whom', 'this', 'that', "that'll", 'these', 'those', 'am', 'is', 'are', 'was', 'were', 'be', 'been', 'being', 'have', 'has', 'had', 'having', 'do', 'does', 'did', 'doing', 'a', 'an', 'the', 'and', 'but', 'if', 'or', 'because', 'as', 'until', 'while', 'of', 'at', 'by', 'for', 'with', 'about', 'against', 'between', 'into', 'through', 'during', 'before', 'after', 'above', 'below', 'to', 'from', 'up', 'down', 'in', 'out', 'on', 'off', 'over', 'under', 'again', 'further', 'then', 'once', 'here', 'there', 'when', 'where', 'why', 'how', 'all', 'any', 'both', 'each', 'few', 'more', 'most', 'other', 'some', 'such', 'no', 'nor', 'not', 'only', 'own', 'same', 'so', 'than', 'too', 'very', 's', 't', 'can', 'will', 'just', 'don', "don't", 'should', "should've", 'now', 'd', 'll', 'm', 'o', 're', 've', 'y', 'ain', 'aren', "aren't", 'couldn', "couldn't", 'didn', "didn't", 'doesn', "doesn't", 'hadn', "hadn't", 'hasn', "hasn't", 'haven', "haven't", 'isn', "isn't", 'ma', 'mightn', "mightn't", 'mustn', "mustn't", 'needn', "needn't", 'shan', "shan't", 'shouldn', "shouldn't", 'wasn', "wasn't", 'weren', "weren't", 'won', "won't", 'wouldn', "wouldn't"]
When thinking about what to include or exclude from our list of stopwords, you might consider special nouns or phrases that are unique to certain corpora but don’t contribute much substantive meaning. For e.g., tweets frequently post links to other sites, so we might consider adding url notation to the stop words list.
stop_words.extend(['http', 'https', 'url',
                   'from', 'subject', 're', 'edu', 'use', 'not', 'would', 'say', 'could', 'be',
                   'know', 'good', 'go', 'get', 'do', 'done', 'try', 'many', 'some', 'nice', 'thank',
                   'think', 'see', 'rather', 'easy', 'easily', 'lot', 'lack', 'make', 'want', 'seem',
                   'run', 'need', 'even', 'right', 'line', 'even', 'also'])

# Feel free to add or delete as many stop words as you think necessary
'due', 'process'
'due_process'
'rule_of_law'
'not','fair'
'not_fair'
Building bigram + trigram models and lemmatizing
Let’s form bigrams and trigrams using the Phrases model. Phrases automatically detects common phrases – multi-word expressions, or n-grams – from a stream of sentences.
# Build the bigram and trigram models
bigram = gensim.models.Phrases(tweet_words, min_count=5, threshold=100) # higher threshold means fewer phrases
trigram = gensim.models.Phrases(bigram[tweet_words], threshold=100)
bigram_mod = gensim.models.phrases.Phraser(bigram)
trigram_mod = gensim.models.phrases.Phraser(trigram)
Next, lemmatize each word to its root form, keeping only nouns, adjectives, verbs and adverbs.
We keep only words with the allowed parts of speech tags (allowed_postags) because they are the ones contributing the most to the meaning of the sentences
We use Spacy for lemmatization.
# !python3 -m spacy download en  # may need to run this line in terminal, but only once
spacy.load('en')
from spacy.lang.en import English
parser = English()
Let’s combine our preprocessing steps in a single function
# THIS CAN TAKE SOME TIME TO EXECUTE -- good time for a break
def process_words(texts, stop_words=stop_words, allowed_postags=['NOUN', 'ADJ', 'VERB', 'ADV']):
    """Remove Stopwords, Form Bigrams, Trigrams and Lemmatization"""
    texts = [[word for word in simple_preprocess(str(doc)) if word not in stop_words] for doc in texts]
    texts = [bigram_mod[doc] for doc in texts]
    texts = [trigram_mod[bigram_mod[doc]] for doc in texts]
    texts_out = []
    nlp = spacy.load('en', disable=['parser', 'ner'])
    for sent in texts:
        doc = nlp(" ".join(sent))
        texts_out.append([token.lemma_ for token in doc if token.pos_ in allowed_postags])
    # remove stopwords once more after lemmatization
    texts_out = [[word for word in simple_preprocess(str(doc)) if word not in stop_words] for doc in texts_out]
    return texts_out

data_ready = process_words(tweet_words)  # processed Text Data!
data_ready[10]
['argue',
 'condition',
 'proletarian',
 'state',
 'state',
 'capitalism',
 'necessarily',
 'transitional',
 'phase',
 'socialism',
 'co']
Topic Modeling with Gensim
There are many ways to run a topic model in Python using several different packages. One popular, powerful tool is the Gensim package, an open-source library for unsupervised topic modeling and natural language processing that uses modern statistical machine learning and is implemented in Python and Cython.
Whichever package you use is up to you, but Gensim has a lot of cool visual features associated with the package.
Let’s look at some of these visuals below. But first, let’s re-run our LDA topic model so it’s in Gensim’s format.
import pprint

# Create Dictionary
id2word = corpora.Dictionary(data_ready)

# Create Corpus: Term Document Frequency
corpus = [id2word.doc2bow(text) for text in data_ready]

# Build LDA model
lda_model = gensim.models.ldamodel.LdaModel(corpus=corpus,
                                           id2word=id2word,
                                           num_topics=10,
                                           random_state=100,
                                           update_every=1,
                                           chunksize=10,
                                           passes=10,
                                           alpha='symmetric',
                                           iterations=25,
                                           per_word_topics=True)
lda_model.print_topics() # the numbers are the probability weights of each word in each topic
[(0,
  '0.000*"ortozcv" + 0.000*"oldugu" + 0.000*"unutmamalıyız" + 0.000*"oyle" + 0.000*"boyle" + 0.000*"knock" + 0.000*"stone" + 0.000*"addiction" + 0.000*"nytopinion" + 0.000*"voorbereiding"'),
 (1,
  '0.105*"autocracy" + 0.059*"people" + 0.028*"way" + 0.027*"power" + 0.025*"country" + 0.018*"long" + 0.017*"political" + 0.016*"come" + 0.016*"bad" + 0.015*"fascism"'),
 (2,
  '0.000*"ortozcv" + 0.000*"oldugu" + 0.000*"unutmamalıyız" + 0.000*"oyle" + 0.000*"boyle" + 0.000*"knock" + 0.000*"stone" + 0.000*"addiction" + 0.000*"nytopinion" + 0.000*"voorbereiding"'),
 (3,
  '0.094*"autocracy" + 0.062*"vote" + 0.024*"law" + 0.023*"system" + 0.022*"election" + 0.020*"give" + 0.016*"democratic" + 0.013*"still" + 0.012*"dictatorship" + 0.012*"life"'),
 (4,
  '0.089*"autocracy" + 0.037*"amp" + 0.029*"must" + 0.026*"time" + 0.022*"take" + 0.018*"well" + 0.017*"happen" + 0.017*"read" + 0.016*"live" + 0.015*"party"'),
 (5,
  '0.074*"hide" + 0.072*"nowhere" + 0.062*"realdonaldtrump" + 0.048*"togo" + 0.037*"great" + 0.033*"fight" + 0.029*"call" + 0.020*"history" + 0.019*"activist" + 0.015*"land"'),
 (6,
  '0.000*"ortozcv" + 0.000*"oldugu" + 0.000*"unutmamalıyız" + 0.000*"oyle" + 0.000*"boyle" + 0.000*"knock" + 0.000*"stone" + 0.000*"addiction" + 0.000*"nytopinion" + 0.000*"voorbereiding"'),
 (7,
  '0.076*"government" + 0.042*"leader" + 0.030*"become" + 0.022*"free" + 0.021*"move" + 0.021*"elect" + 0.021*"place" + 0.020*"care" + 0.017*"issue" + 0.016*"next"'),
 (8,
  '0.209*"democracy" + 0.043*"state" + 0.039*"end" + 0.027*"stop" + 0.019*"world" + 0.019*"oligarchy" + 0.016*"watch" + 0.015*"corruption" + 0.015*"help" + 0.014*"socialism"'),
 (9,
  '0.155*"co" + 0.145*"autocracy" + 0.036*"trump" + 0.027*"rule" + 0.017*"mean" + 0.014*"year" + 0.012*"much" + 0.011*"allow" + 0.011*"already" + 0.010*"hold"')]
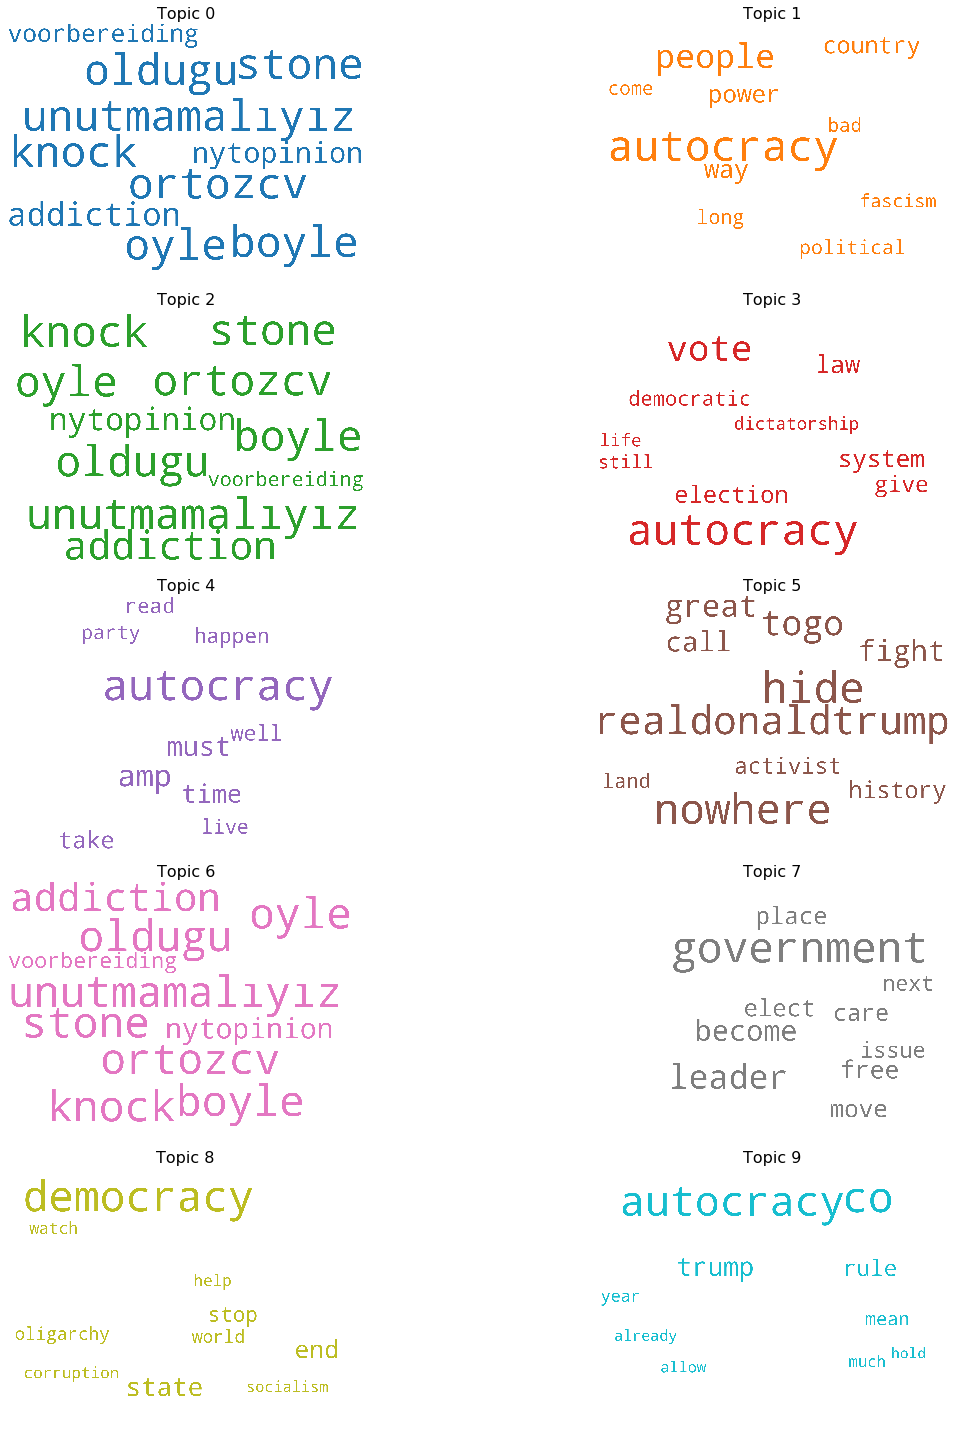
Wordcloud
The easiest visual we can make is a word cloud – a plot that shows the top N words in each topic (more frequent words are larger)
#!pip install wordcloud # un-comment if you need to install wordcloud

from matplotlib import pyplot as plt
from wordcloud import WordCloud, STOPWORDS
import matplotlib.colors as mcolors

# create a list of color names
cols = [color for name, color in mcolors.TABLEAU_COLORS.items()]  # more colors: 'mcolors.XKCD_COLORS'

cloud = WordCloud(stopwords=stop_words,
                  background_color='white',
                  width=2500,
                  height=1800,
                  max_words=10,
                  colormap='tab10',
                  color_func=lambda *args, **kwargs: cols[i],
                  prefer_horizontal=1.0)

topics = lda_model.show_topics(formatted=False)

fig, axes = plt.subplots(5, 2, figsize=(20,20), sharex=True, sharey=True)

for i, ax in enumerate(axes.flatten()):
    fig.add_subplot(ax)
    topic_words = dict(topics[i][1])
    cloud.generate_from_frequencies(topic_words, max_font_size=300)
    plt.gca().imshow(cloud)
    plt.gca().set_title('Topic ' + str(i), fontdict=dict(size=16))
    plt.gca().axis('off')


plt.subplots_adjust(wspace=0, hspace=0)
plt.axis('off')
plt.margins(x=0, y=0)
plt.tight_layout()
plt.show()
An Interactive Topic Model Plot
pyLDAvis is designed to help users interpret the topics in a topic model that has been fit to a corpus of text data. The package extracts information from a fitted LDA topic model to inform an interactive web-based visualization.
The visualization is intended to be used within an IPython notebook but can also be saved to a stand-alone HTML file for easy sharing.
#!pip install pyLDAvis #uncomment to install this on your machine
import pyLDAvis.gensim
pyLDAvis.enable_notebook()
vis = pyLDAvis.gensim.prepare(lda_model, corpus, dictionary=lda_model.id2word)
vis
What are we looking at here?
Different elements of pyLDAvis:
-
Topic Circles: one for each topic; areas are proportional to the relative weight of a given topic in the corpus, based on the total number of tokens in the corpus.
-
Red Bars: represent the estimated number of times a given term was generated by a given topic. When a topic circle is selected, we show the red bars for the most relevant terms for the selected topic.
-
Blue Bars: represent the overall frequency of each term in the corpus. When no topic circle is selected, we display the blue bars for the most salient terms in the corpus; when a topic circle is selected, the blue bar will still be displayed if a given term is one of the top terms in the corpus.